VORTEX-SE
Towards a better understanding of tornadogenesis and tornado environments in the Southeastern U.S.
Case Evaluation - IOP3: 3 April, 2018
Evaluating dual-Doppler, dual-pol, surface, and upper air, and data collected during a QLCS with embedded small-scale vortices in northern Alabama. Damaging winds were reported during IOP3.
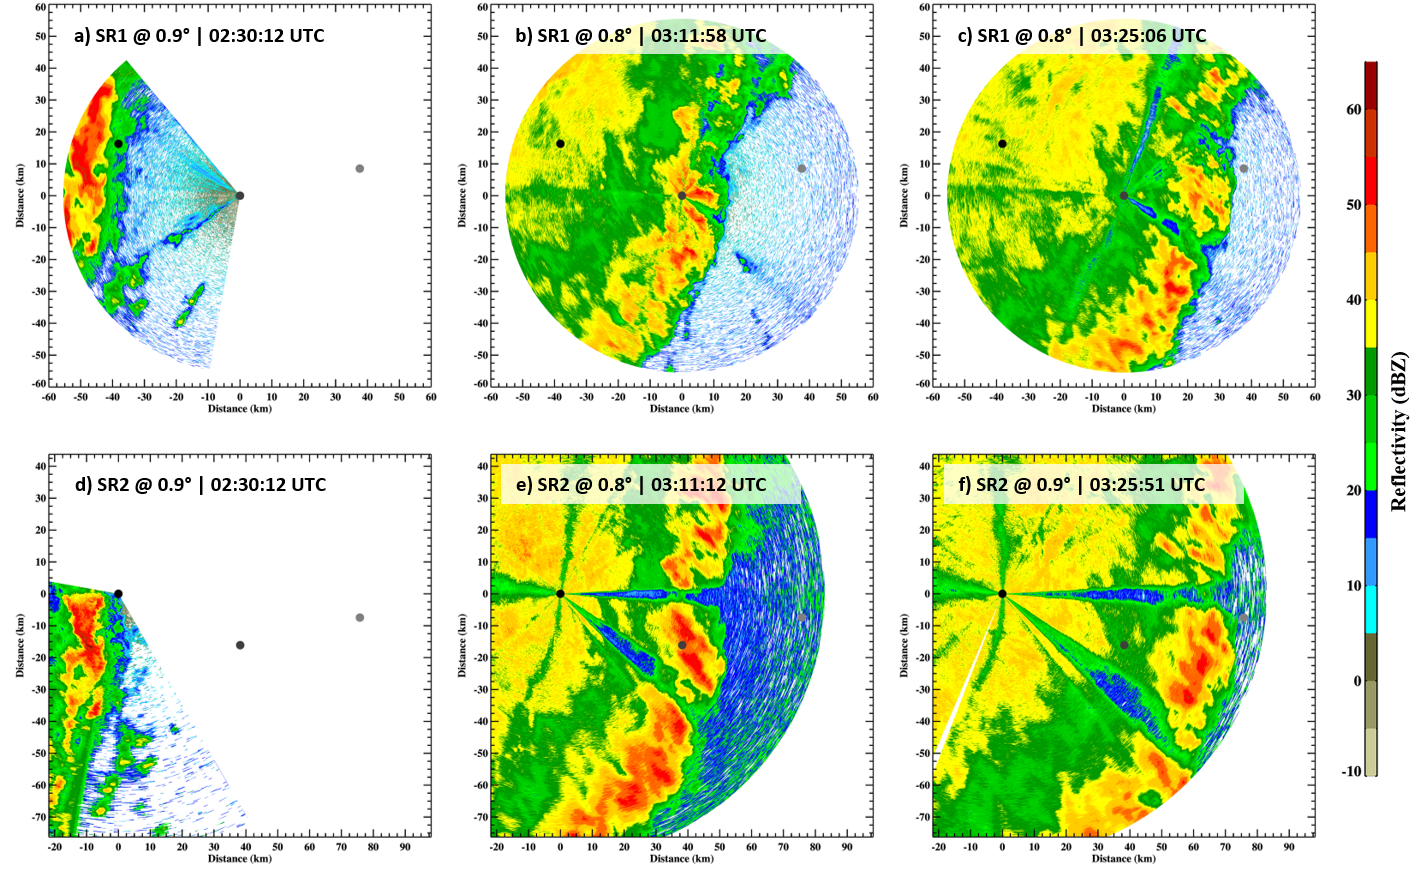
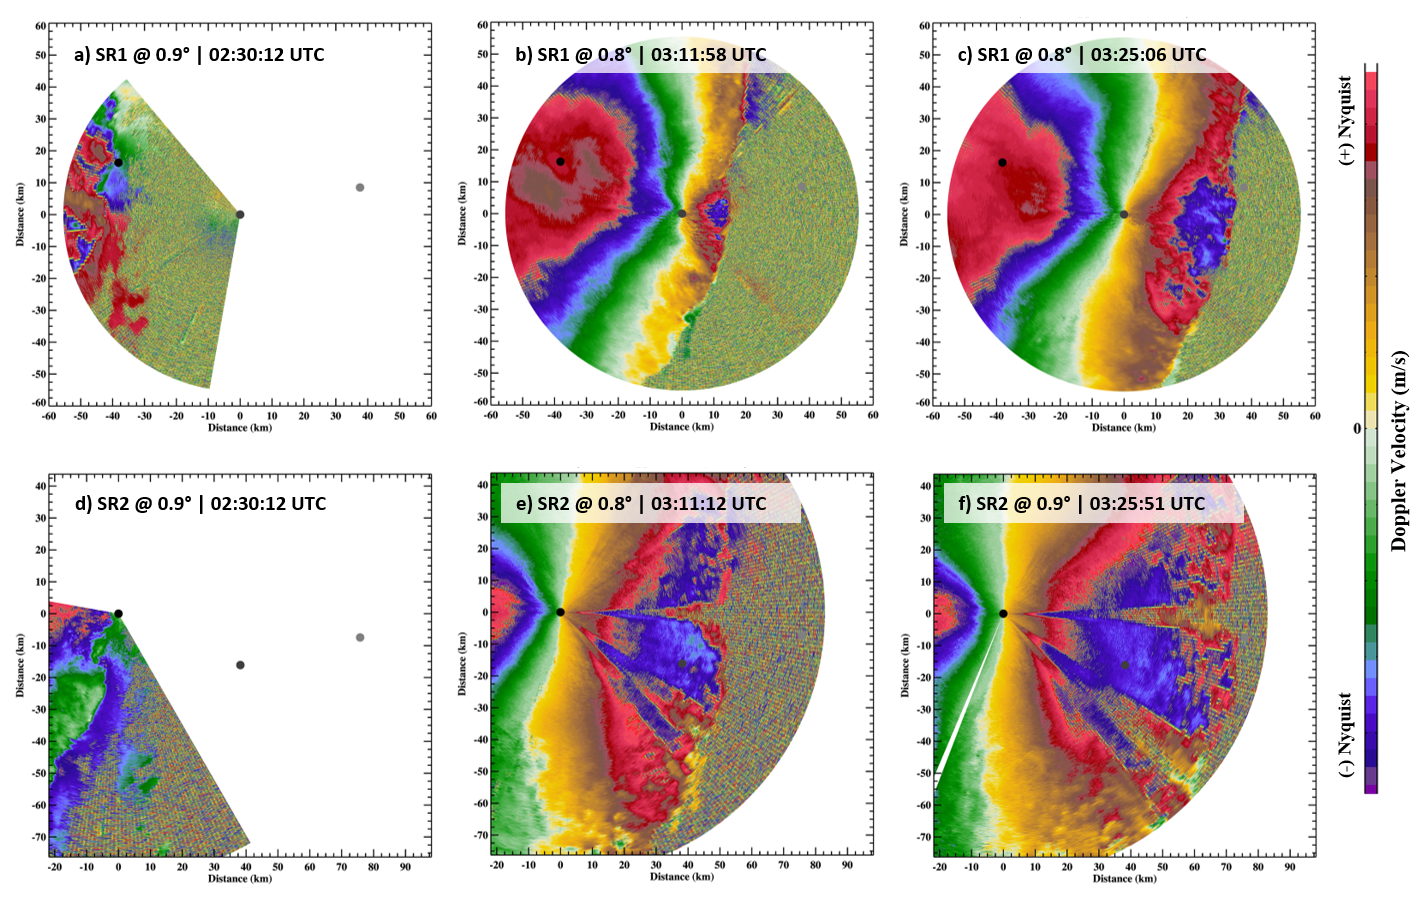
(right) Radar refectivity from SR1 (top row) and SR2 (bottom row) at three time periods on 4 April 2018 during IOP3 as a quasi-linear convective system (QLCS) moved through the ground-based radar domain. The chosen scans were selected so as to line up as close as possible to the same times and scan elevations. The top row shows SR1 radar scans at a) 0.9°, b) 0.8°, and c) 0.8° elevation angles with scan start times of a) 02:30:12 UTC, b) 03:11:58 UTC, and c) 03:25:06 UTC. The bottom row shows SR2 radar scans at a) 0.9°, b) 0.8°, and c) 0.9° elevation angles with scan start times of a) 02:30:12 UTC, b) 03:11:12 UTC, and c) 03:25:51 UTC. The refectivity color contours are specifed by the color table on the right. SR1, SR2, and UAH MAX radar locations are shown with black dots. (left) Doppler velocity. The Doppler velocity color contours are specifed by the color table on the right, which range between +/- the Nyquist velocity.
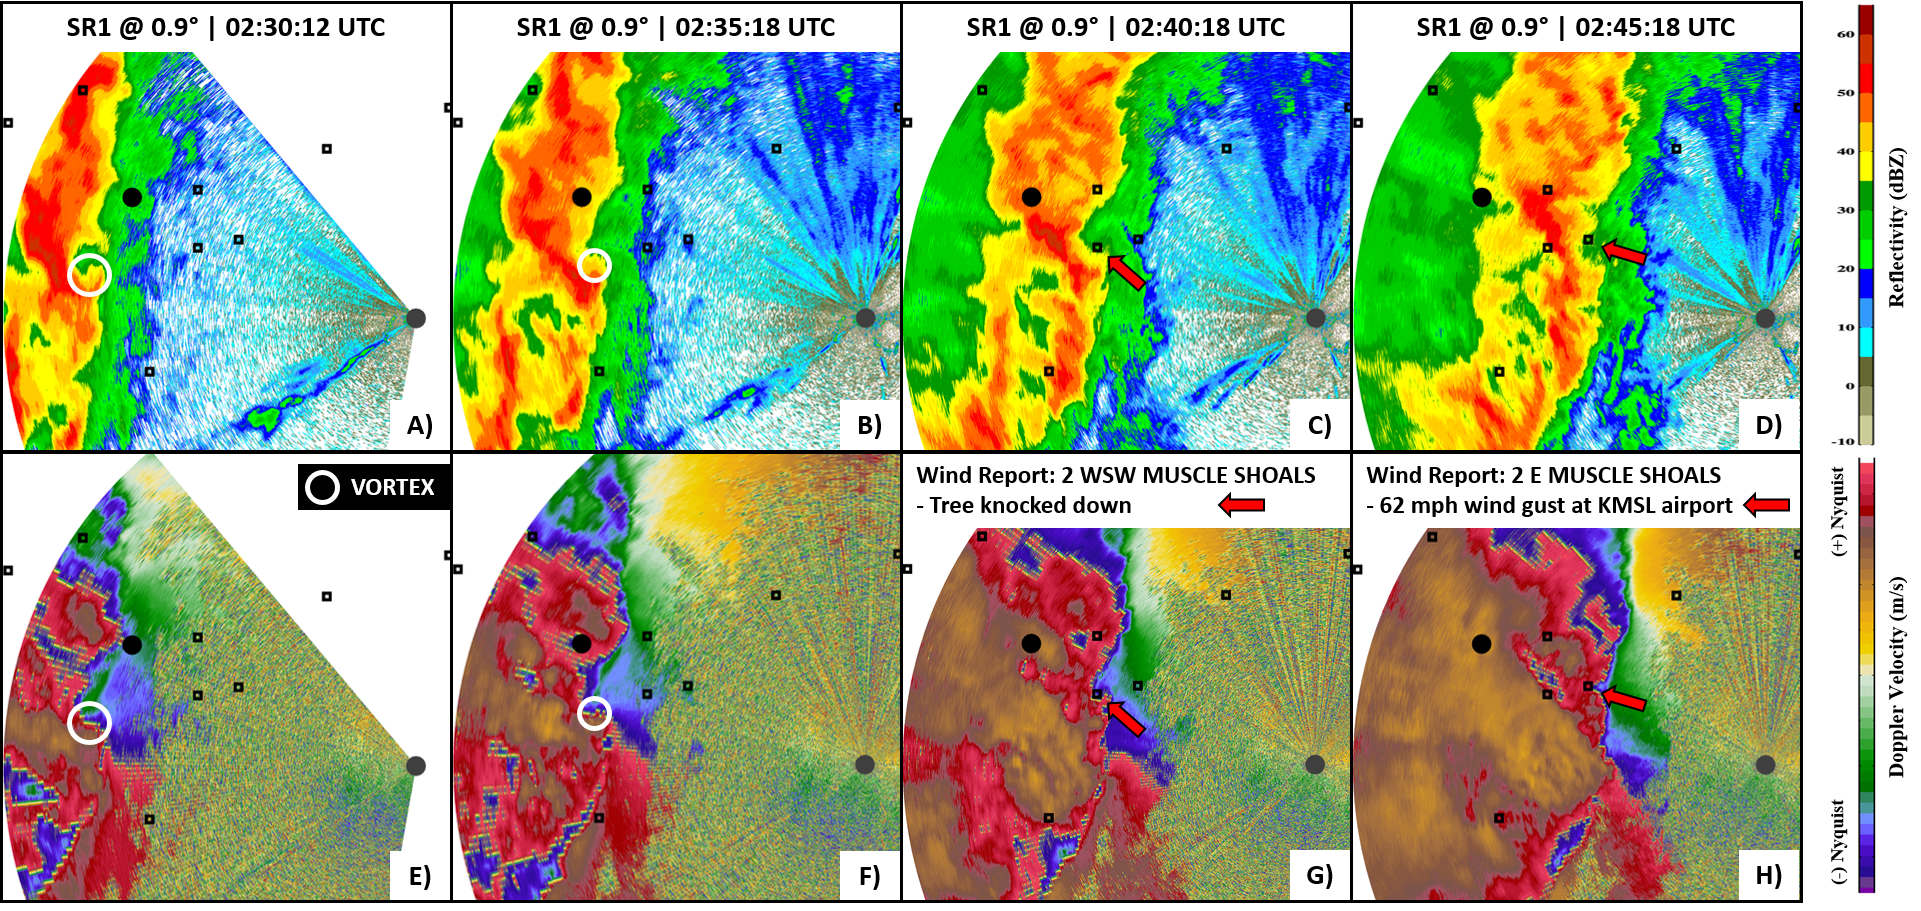
Refectivity (top row) and Doppler velocity (bottom row) unedited radar felds measured by the SR1 radar at A) E) 02:30:12 UTC, B) F) 02:35:18 UTC, C) G) 02:40:18 UTC, and D) H) 02:45:18 UTC on 4 April 2018 during VSE IOP3. SR1 and SR2 radar locations are overplot similar to Fig. 1 (flled circles) and Storm Prediction Center (SPC) severe wind reports are overplot as open black squares. A noticeable vortex signature evident in the Doppler velocity felds is highlighted in A), B), E), and F) with a white circle, with the relative vortex minima/maxima in radial Doppler velocity roughly lined up with the diameter of the circle. Two SPC wind reports are highlighted in C), G) and D), H) with a red arrow near the time that the vortex passed over each report location. Refectivity and Doppler radial velocity colorbars are on the right, with the Doppler velocity colorbar ranging between +/- the Nyquist velocity.